The PISA 2015 test results have brought more bad news for Australia's education system with student performances in scientific, reading and mathematical literacy all in ‘absolute decline'.
The large-scale, international comparative test measures how well 15-year-olds are prepared to use their skills and knowledge to meet real-life challenges. More than 500 000 students from 72 countries and partner economies took part in the 2015 test cycle.
PISA (Programme for International Student Assessment) tests have taken place every three years since 2000 and are conducted in Australia on behalf of the OECD by the Australian Council for Education Research (ACER).
According to a report released today by ACER – PISA 2015: A first look at Australia's results – Australia performed equal 10th in science with an average score of 510 points, equal 12th in reading (503 points) and equal 20th in mathematics (494 points).
To put those results in perspective, Singapore topped the PISA 2015 rankings for all three domains with average points scores of 556 in scientific literacy, 535 in reading literacy and 564 in mathematical literacy. That means Singapore's students are ahead of Australia's in science by the equivalent of one-and-a-half years of schooling, in reading by around one year of schooling, and in maths by around two-and-a-third years of schooling.
Nestling behind Singapore in top spot in the global rankings: Japan, Estonia, Chinese Taipei and Finland complete the top five for scientific literacy; Hong Kong (China), Canada, Finland and Ireland complete the top five for reading literacy; and Hong Kong (China), Macao (China), Chinese Taipei and Japan complete the top five for mathematical literacy.
What does it mean for Australia?
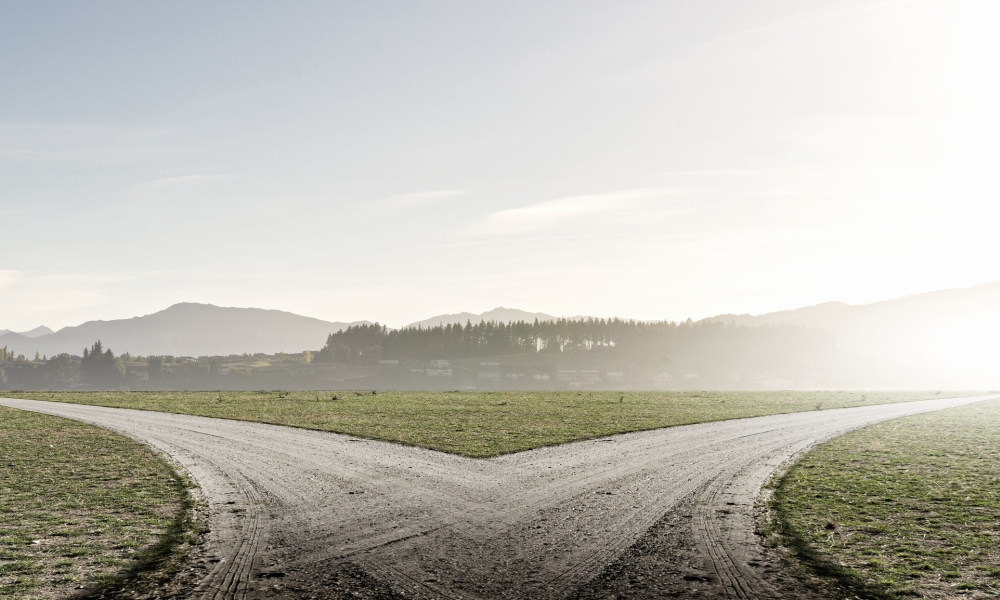
Releasing today's report, lead author Dr Sue Thomson, ACER Director of Educational Monitoring and Research, said the evidence is clear that Australian student performance is in absolute decline and the country is now at an ‘educational crossroad'.
‘Results from the 2015 Trends in International Mathematics and Science Study (for Years 4 and 8) released last week indicate that, although we are slipping backwards relative to other countries, Australian student achievement against the mathematics and science curriculum is unchanged.
‘Results from PISA 2015 suggest the situation is much worse: Australian students' ability to apply their mathematical and scientific knowledge to real life stations is falling not only relative to other countries but also in an absolute sense.'
Rather than measuring how well students have learned a specific curriculum, PISA examines their ability to apply their learning. Global rankings aside, given that the test is for 15-year-olds (as a sizeable chunk prepare to enter the workforce), data showing the proportion of Australia's low performing students has increased over time in all three domains is concerning. On the PISA proficiency scales, low performers are students who are below Level 2 – the proficiency considered ‘too low to enable them to participate effectively and productively in life'.
[Here, Dr Sue Thomson, ACER Director of Educational Monitoring and Research and lead author of the report, joins Teacher to discuss the PISA 2015 results.]
Results at a glance
Number of countries/economies that performed significantly higher than Australia:
Science: 9
Reading: 11
Mathematics: 19
Number of countries/economies that performed at a similar level to Australia:
Science: 8
Reading: 13
Mathematics: 10
Number of countries/economies that performed significantly lower than Australia:
Science: 39
Reading: 27
Mathematics: 25
Scientific literacy
- Australia was one of 13 countries to show a significant decline in performance between 2006 (the last time scientific literacy was the major domain) and 2015. For Australia this decline was equivalent to around half a year of schooling. Six countries significantly improved their performance between 2006 and 2015.
- In Australia, 61 per cent of students met or exceeded the National Proficient Standard, (compared to 75 per cent in Singapore), and 11 per cent were considered high performers, (compared to 24 per cent in Singapore).
- The mean scientific literacy performance of students declined significantly between PISA 2006 and PISA 2015 in all Australian states and territories except Victoria and the Northern Territory, where achievement was not significantly different.
- In PISA 2015, the difference between the average scientific literacy score for the highest-performing state or territory (ACT) and the lowest-performing (Tasmania), was the equivalent of around one-and-a-half years of schooling.
Reading literacy
- Australia was one of nine countries to show a significant decline in performance between 2009 (the last time reading literacy was the major domain) and 2015. For Australia this decline was equivalent to almost half a year of schooling. Fourteen countries significantly improved their performance between 2009 and 2015.
- In Australia, 61 per cent of students met or exceeded the National Proficient Standard, (compared to 72 per cent in Singapore), and 11 per cent were considered high performers, (compared to 18 per cent in Singapore).
- The 2015 average performance of students in Tasmania, the ACT, New South Wales, South Australia and Western Australia has declined significantly since PISA began in 2000; Queensland, the Northern Territory and Victoria performed at a similar level to PISA 2000.
- The difference between the average reading literacy score for the highest-performing state or territory (ACT) and the lowest-performing (NT) was the equivalent of around one-and-a-half years of schooling.
Mathematical literacy
- Australia was one of 10 countries to show a significant decline in performance between 2012 (the last time mathematical literacy was the major domain) and 2015. For Australia this decline was equivalent to around one third of a year of schooling. Eight countries significantly improved their performance between 2012 and 2015.
- In Australia, 55 per cent of students met or exceeded the National Proficient Standard, (compared to 80 per cent in Singapore), while 11 per cent of students were considered high performers, (compared to 35 per cent in Singapore).
- All states and territories, except Victoria and the NT, showed a significant decline in performance between PISA 2003 and PISA 2015.
- The difference between the average score for the highest-performing state or territory (ACT), and the lowest-performing (Tasmania), was the equivalent of more than one year of schooling.
Indigenous and non-Indigenous students
In Australia, in scientific literacy the gap between the average score of Indigenous and non-Indigenous students is equivalent to around two-and-a-half years of schooling; in reading literacy the gap equates to around three years of schooling; and in mathematical literacy the difference in average scores is equivalent to more than two-and-a-third years of schooling.
Socioeconomic status
In Australia, in scientific literacy the difference between the average score of students in the highest socioeconomic quartile and those in the lowest socioeconomic quartile equates to around three years of schooling; in reading literacy the difference is equivalent to around three years of schooling; and in mathematical literacy the difference in average scores equates to almost three years of schooling.
Where to find more information
PISA 2015: A first look at Australia's results, by Sue Thomson, Lisa De Bortoli, and Catherine Underwood, and further information about the PISA assessment is available from the Australian PISA website www.acer.edu.au/ozpisa.
You can test yourself on sample PISA 2015 science questions and find out more about the concepts and competencies covered and proficiency levels by clicking on the link.


